
Here’s how Standard Deviation calculations can figure in ammo decisions (or not…) READ MORE…
Glen Zediker
Seems like the last couple of articles on load testing and velocity data got some pretty good responses and attention, and so that means there’s more! Of course there is…
As said, Standard Deviation (SD) plotted out forms a bell curve. A bell curve indicates the “probability density” of the normal distribution, or range, for something like velocity consistencies. For our purposes that’s the likely speed of the next shot.
Chances are outstanding that running all the numbers gotten from a chronograph session will plot into what’s called a “normal curve.” Like any normal bell curve, it gets divided into three segments and values, and these divisions are the “standard deviations.” And remember it is “a” standard deviation.
(I’ve said many a time that I’m sho no mathematician, and I am aware that there’s more and different ways to apply and model a curve, and to manipulate standard deviation results for different applications, but I’m trying to keep it more simple and use this “normal curve” for examples, it’s also called “population standard deviation.”)
We’ve been working with the right-respectable SD example of 12.
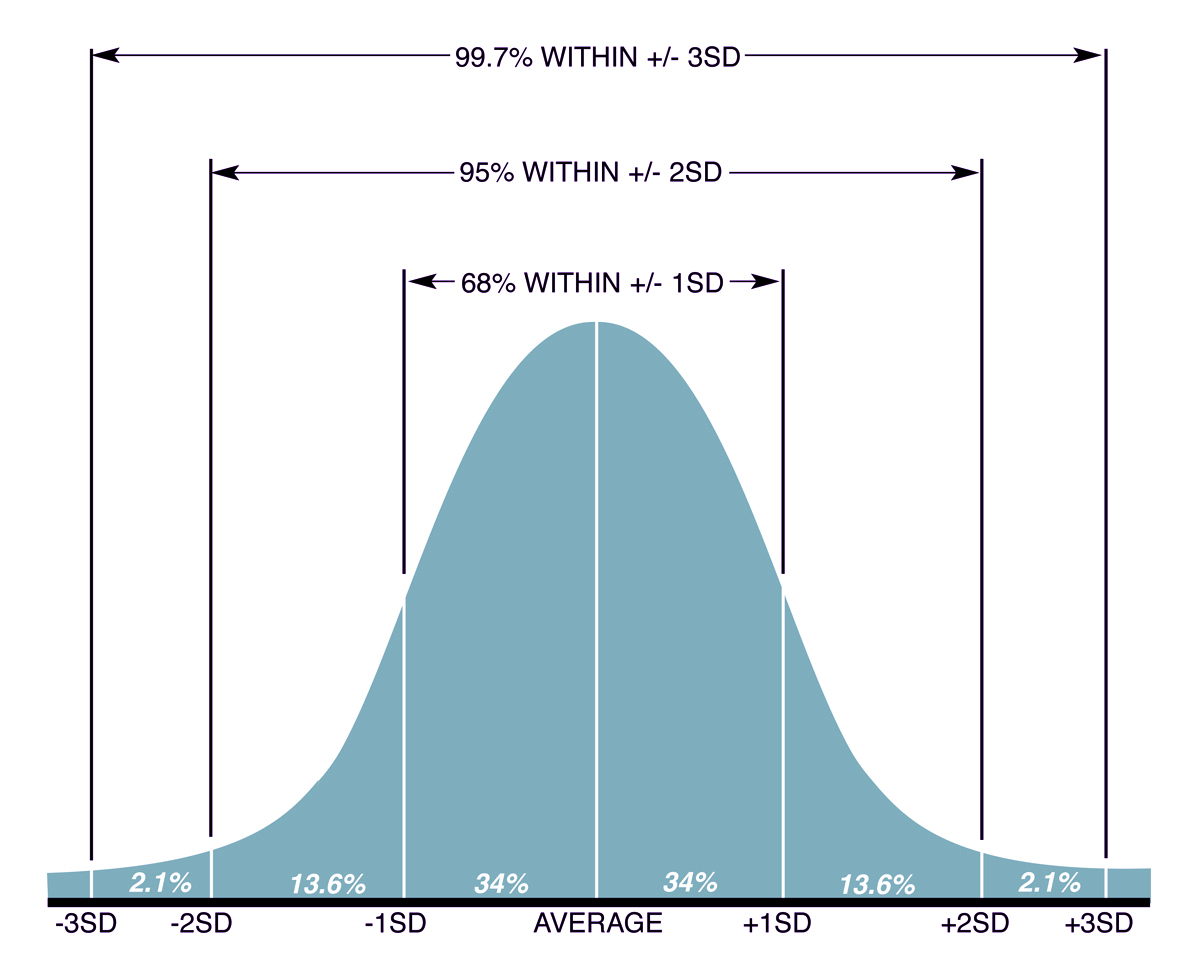
Assuming that normal curve, the distribution of “some number” of shots is forecasted like so: some 68 percent will lie within 1 standard deviation of the mean, about 95 percent lie within 2, and over 99 percent lie within 3 standard deviations. Again, since our SD is 12, then about 68 percent (approx. 2 out of 3) of all “next shots” will be +/- 12 feet per second. Since, though, the curve is in threes, that means that a scant number of the shots pose a chance for +/- 24 and some much (much) smaller chance remains for some shots to go to +/- 36. SD estimates how likely it is for those “head-scratchers” to show up, and also what might be the most realistic extreme any shot can deviate.
Data is a record of numbers and I do know that there’s 100-percent chance that the highest and lowest velocities collected for an SD calculation did, in fact, happen. To me, that’s what matters. No matter what the collected shot results calculated into for an SD, those were the two that represent the highest and lowest prints on the target.
It’s mathematically not possible for an SD to be higher than the greatest single measured deviant, and an SD can sho be lower than any single “bad” shot. Given how it’s calculated, along with how many samples contributed to the calculation, it’s plain that the nearer the majority are to themselves the less impact a bad one or more has. The more input the better.
Many of us have heard or read the frequently-sung “…seen good accuracy with high SDs…” And we’ve probably also all decided that can’t be taken at literal value. Well, it can’t. Three things: what is “good accuracy” to this fellow, at which distance were the groups printed, and what’s he say is “high,” because without knowing these things there’s no accounting for the accuracy, believability, or interpretative definitiveness of what’s being said. So I say it’s 12. A 12 should not be responsible for a points loss, also considering the edge limits of usual group size. Getting into more and more numbers derived from more and more “what if’s” plotting out bullet trajectories and wind drift amounts, and, always assuming a consistent bullet ballistic coefficient demonstration (also not likely) running “12” through all these mathematical-hypothetical scenarios will show that 12 doesn’t lose many, if any, points.
One last that isn’t really a strong point, but is a point… If we’re shooting something like a .223 Rem. then a half-grain is about 40 feet per second. If that 12 SD shows its worst and pops one out +36 feet per second, to me that represents something akin to a pressure spike (logic dictates that more velocity had something to do with more pressure). I know my loads are running a tad amount edgy, and seeing a small velocity variation is likewise a tad amount more reassuring that a primer won’t go over the edge.
TESTING TIP
If you’re testing much beyond 200 yards, and especially beyond 300, pay no mind to the left and right, but keep a close watch on the up and down. In ideal conditions, groups are supposed to be round (I’m convinced they’re actually square, but there’s no need to go into that). If there’s any wind, don’t even try to correct for it (as long as impacts are on the target). I honestly don’t need a chronograph to confirm load consistency if I’m seeing small vertical dispersions. I’ll already have speed-checked the load I’m down on the mat with, and, again, I’m just wanting to see how level I get my perforations. If I come out with a 600-yard group that’s a foot wide but only three inches tall, I’m happy.
6 TIPS FOR LOWER SDs
Aside from finding the perfect and magical load combination, ha, there are a few things that do seem to help tighten shot-to-shot velocity deviations. They’ve all be talked all the way through and back again in this space in other articles, but, considered ultimately that this is the overall effect they have, here they are again:
One. Primer seating: fully seated onto a flat pocket bottom.
Two. Consistent propellant charge: weigh the charges if metering isn’t dead-on.
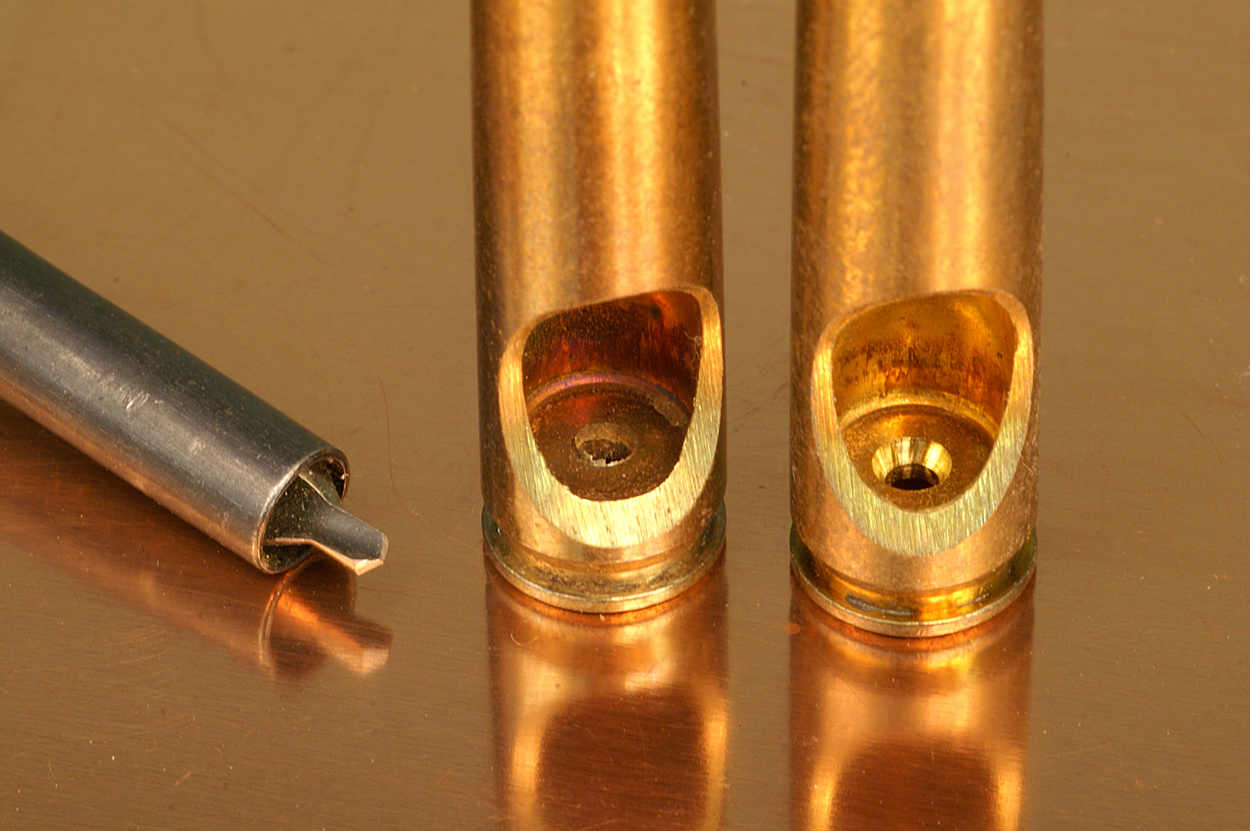
Three. Ignition efficiency: consider trying that inside flash hole deburring routine…
Four. Consistent case neck sizing, and, believe it or not, about 0.003 worth of “tension.” Don’t go too light…
Five. Temperature insensitivity: choose propellants that exhibit stability under extremes.
Six. Balance: strive to find a propellant that fills the case, but “loosely” (no compressed charges); even more, avoid an overage of air space. These both allow too much variance in ignition pattern.
This article is adapted from Glen’s books, Handloading For Competition and Top-Grade Ammo, available at Midsouth HERE. For more information about other books by Glen, visit ZedikerPublishing.com